Estimation is something that my students have always struggled with. In my experience, some reasons for this are that
a.) students are rarely asked to do it,
b.) students are conditioned to not take risks in math class, and
c.) there is a genuine fear of being wrong that students grapple with when engaging in mathematics. But take a second to consider
how often, in the course of a single day, do we make estimates? Whether it be at the grocery store, driving in your car, or cooking a meal, I would argue that it is a skill that we use on a regular basis.
So, how do we get students to develop this skill? I heard Dan Meyer (
http://blog.mrmeyer.com) speak a few months ago and as we were working through a series of problems, he asked us to write down an answer that we knew was too high and one we knew to be too low. I had never done this before, but this particular strategy helped lower my fear of being wrong because, in a way, he was asking me to be exactly that...
wrong. Calling it out, and recognizing that this particular answer that I'm giving you is incorrect, provided the safe space to take risks and explore the solution more authentically.
I have made it a priority to provide my students with opportunities to engage in mathematical modeling tasks this year. I wrote about our first modeling experience back in August (
What Do You Mean, There's No Right Answer?!?) and since then, I have noticed that students are more willing to take risks, try a variety of methods, and overall be less comfortable (that's when I know they're learning). Last week, I gave them a task called "
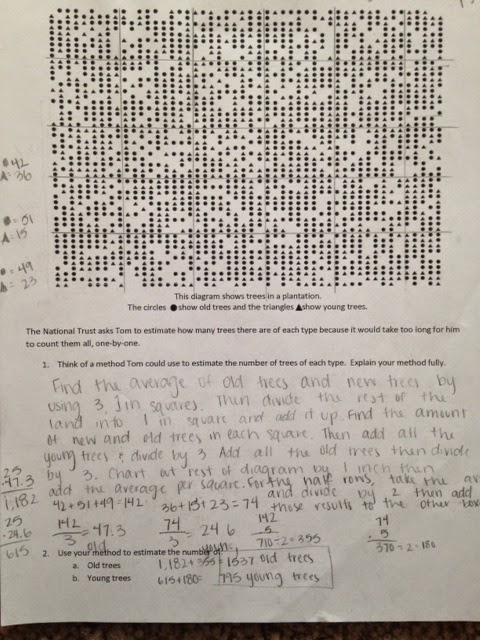
Counting Trees" from the
Mathematics Assessment Project website. This particular task necessitates the use of
estimation and
communicating reasoning; two skills that I know my students need to work on.
When I handed this task to my students, there was a general feeling of
annoyance and
irritation. "Do we really have to count all of these trees? That's going to take forever!" I told my students that I couldn't agree more, how annoying would it be to have to count all of these trees? But then I directed them to the wording of the task, "Think of a method Tom could use to
estimate the number of trees of each type." This seemed to help with the grumbling and students felt a little less anxiety about having to actually count the trees.
When I worked on this problem for myself, I approached my estimation as a sampling of the entire collection of trees. I broke it into smaller, more manageable pieces and then scaled up. I have done this task with teachers and this is a very common approach, so I anticipated seeing it a lot with my students, but that was not the case.
More about that later.
In my experience, a modeling or open-ended task can be
extremely meaningful for students, but to get the most "bang for my buck", I have learned that it is essential for me to have a
game plan. When I first started doing these kinds of tasks, I would just give them to my students and see what happened. There were exciting moments, but I felt like the experience as a whole lacked coherence and a sense of culmination. I hadn't really answered that "
So what?" question. For the Counting Trees task, I tried taking notes in a systematic way so that I could structure the conversation/debrief in a way that made sense as well as answered the "
So what?" question.
The first picture is the document that I created for each class period. I was curious what methods I would see my students using, but I wanted to remember who used that particular method, and then I wanted to record how many old and new trees their method got them. The second picture is from all three of my classes. I wanted to get a record of what numbers student were coming up with. I then wrote the number of old and number of new trees on the board in order from least to greatest number of old (along with its corresponding number of new trees). See below.


These records of student data (above) helped drive the conversation about how many old and new trees Tom could estimate to be in the plantation. I began by asking students to look at the data and give an argument as to why they disagreed with a particular data set, and why. For example, in the first picture, students were not comfortable with the 89, 37 numbers because they knew that there were way more than 126 trees in the picture. In the second picture, students were not comfortable with the 330, 110 numbers because that was a total of 440 trees and they knew that there was enough space for 2500 trees, which would have accounted for only 18% of the plantation. Looking at the picture, they knew that there needed to be more trees. Similarly, the 1500, 750 data was, for some students, too high of an estimate. They did not think that 90% of the plantation was covered with trees. There was not consensus on this point, however. Some students argued that this was reasonable.
As the discussion continued, I asked student to come to the document camera and explain the method they used to estimate the number of new and old trees in the plantation. I started with the most common approach, which was to count the number of new and old trees in a single row and the number of new and old trees in a single column and multiply the two numbers together. Some students described this as being similar to a multiplication chart, others thought of it as an area model.
Please note that all of these student work samples come from different classes and are a sample of each approach to the problem.
Row Times Column:
I then built on this idea, but showed a slightly different approach where students didn't look at a single row and column, but instead at the perimeter of the plantation.
Perimeter:
Students discussed similarities and differences between the two methods, which they thought would be more accurate, and even how it was similar or different to their own method.
I then extended the conversation to include student work samples that showed using multiple rows in their sample (as opposed to a single row and column). Students found that this may have been slightly more accurate because it was a larger sample, and still manageable, so they didn't have to try and count all of the trees in the plantation.
Using 4-5 Rows of Trees:
The next set of student work shows the estimation approach of breaking up the plantation in a variety of ways. As I mentioned above, this was the most common approach I saw teachers use, but this was not true for students. The single row and column approach (above) was the most common for students.
Breaking it into Smaller Regions:
After looking at these approaches, several students thought that these would be the most accurate. It was interesting to talk about why different ways of breaking up the plantation may have yielded different estimations. A lot of students said they preferred this method to others they saw or used themselves.
Something that came up in our discussion was and interesting use of division. Some students calculated the number of total trees and then divided by two. I put this back on the students: "What are they assuming by dividing the total number of trees by two?" They were spot on with their response: "They're assuming that there are and equal number of new and old trees." We talked about whether or not that was reasonable. Most students felt that there were not an equal number and that there were more old than new.
Equal Numbers:
Another interesting idea that I saw students using was counting the number of blank spaces and using that to guide their estimate. Essentially, there are three things to consider: number of new trees, number of old trees, and number of blank spaces. Most students only focused on the number of trees, while others thought it was important to also include the number of blanks in their calculations.
Using the Blank Spaces:
Lastly, the approach that I saw that rounded out the conversation dealt with ratios of trees. As you can see, some students were not able to clearly articulate how they intended to use ratios, but I was impressed to see that students were able to make a practical connection to the use of ratios to help guide their estimate. As I said, this was the last approach I showed because for most students, it was the most sophisticated.
Ratios:
In reflecting back on this experience, I think that I could improve it by making stronger connections to the similarities between the various methods. I did my best to bring it back to the mathematics that the students were using, but also, what were the assumptions that they made? Students are learning that just because not everyone arrives at the same answer, they're more or less correct. They are learning that as long as you state your assumptions and use sound mathematics to answer the question, your solution will make sense.
I feel that this was a great task to use for students in developing their writing skills. I would like to place more emphasis on the precision of language next time because I feel like students were a little too vague in their descriptions of their approaches. However, overall, I feel that they were successful and it was an authentic, meaningful experience.
And I know what you're all thinking...Did anyone just count the number of trees?
Yes...yes, they did. :)


